
When you ship a new feed, the first question is always the same: is it working?
Without data, feeds are a black box — you don’t know if users are seeing them, if they’re engaging, or if your ranking strategy is doing what you intended.
That’s why we built Feed Statistics into the Console. It gives you a clear way to measure how your feeds are performing in production, so you can iterate faster and make better decisions.
What feed stats show you
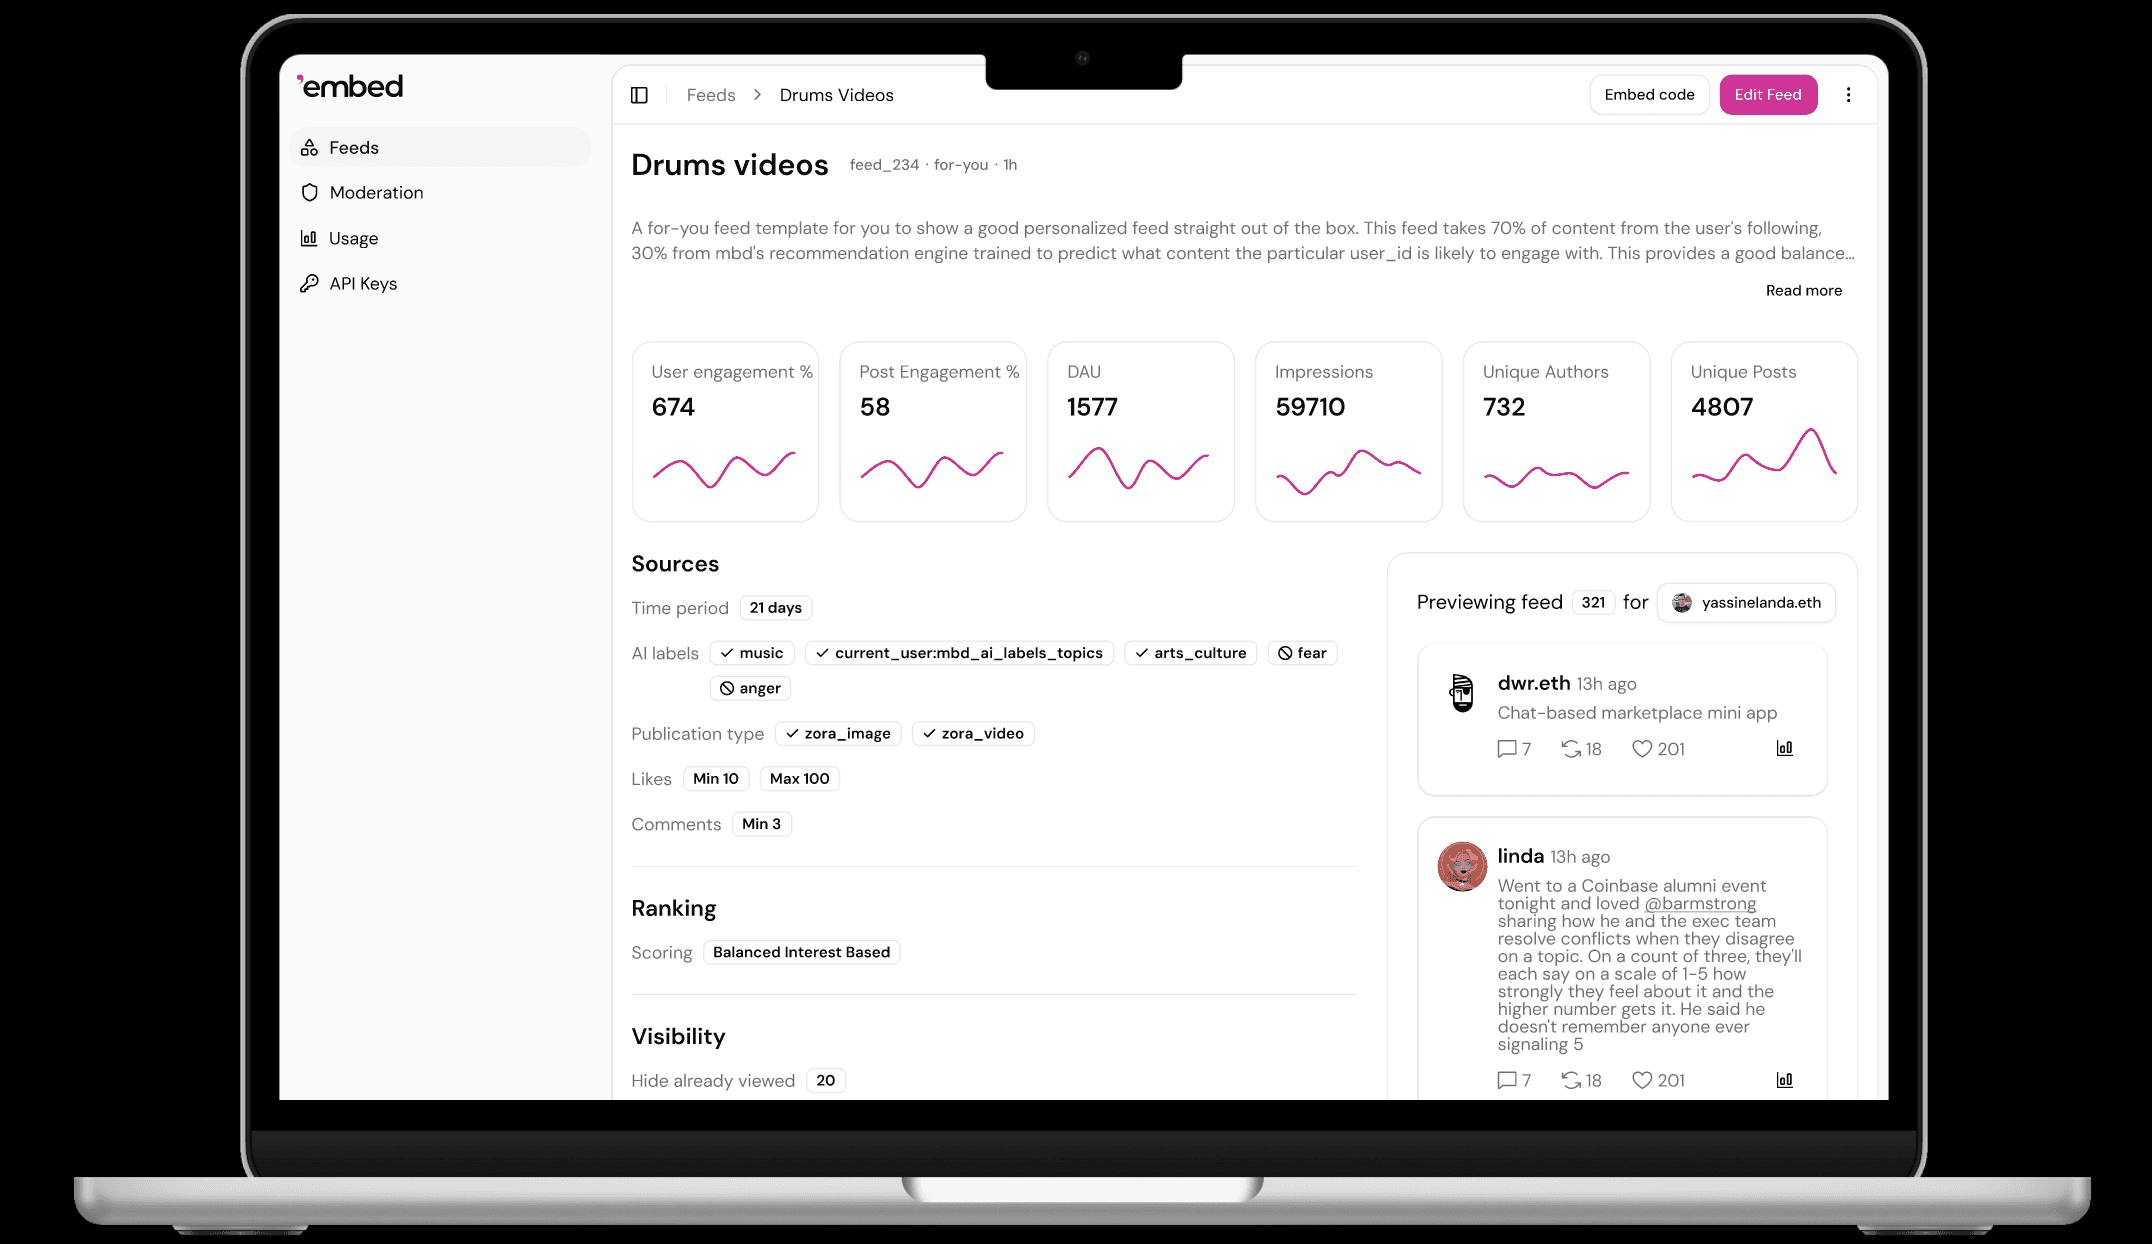
Each feed now comes with a dashboard of performance metrics. Highlighted values are rolling 30-day averages, which makes it easier to see trends over time rather than chasing day-to-day noise.
Core metrics
DAU: number of users who saw or interacted with the feed.
Impressions: total times posts from the feed were served.
Post engagement %: share of served posts that received an interaction.
User engagement %: share of users who engaged with at least one post.
Unique authors: distinct accounts represented (a proxy for diversity).
Unique posts: distinct items shown (a proxy for freshness and variety).
Together they paint a picture of how many people are seeing your feed, how diverse the content really is, and whether users are doing something with it beyond just scrolling.
Interpreting metrics together
Read the metrics in combination to move from symptoms to diagnosis.
-> High impressions + low post engagement % - Likely mismatch between candidate generation/ranking and user interests; revisit candidate sources, time windows, and top feature weights.
-> High post engagement % + low user engagement % - A small cohort loves what they see, but most users don’t engage; broaden topic/author diversity or reduce repeat exposure.
-> High user engagement % + low post engagement % - Many users engage at least once, but not often; consider better sequencing (reduce stale items), improve media mix, or raise quality thresholds.
-> Low unique authors and/or low unique posts - Overfitting to a few creators or items; increase exploration/randomness, add author diversity caps, and widen candidate pool.
-> DAU dips while impressions hold steady - Fallback feed or background delivery may dominate; check latency/circuit breakers and ensure the primary feed is eligible and fresh.
Tip: track all metrics as 30‑day rolling averages and compare week‑over‑week deltas when you ship changes.
From build to iteration
Feed building is never one-and-done. Stats are designed to fit into a feedback loop:
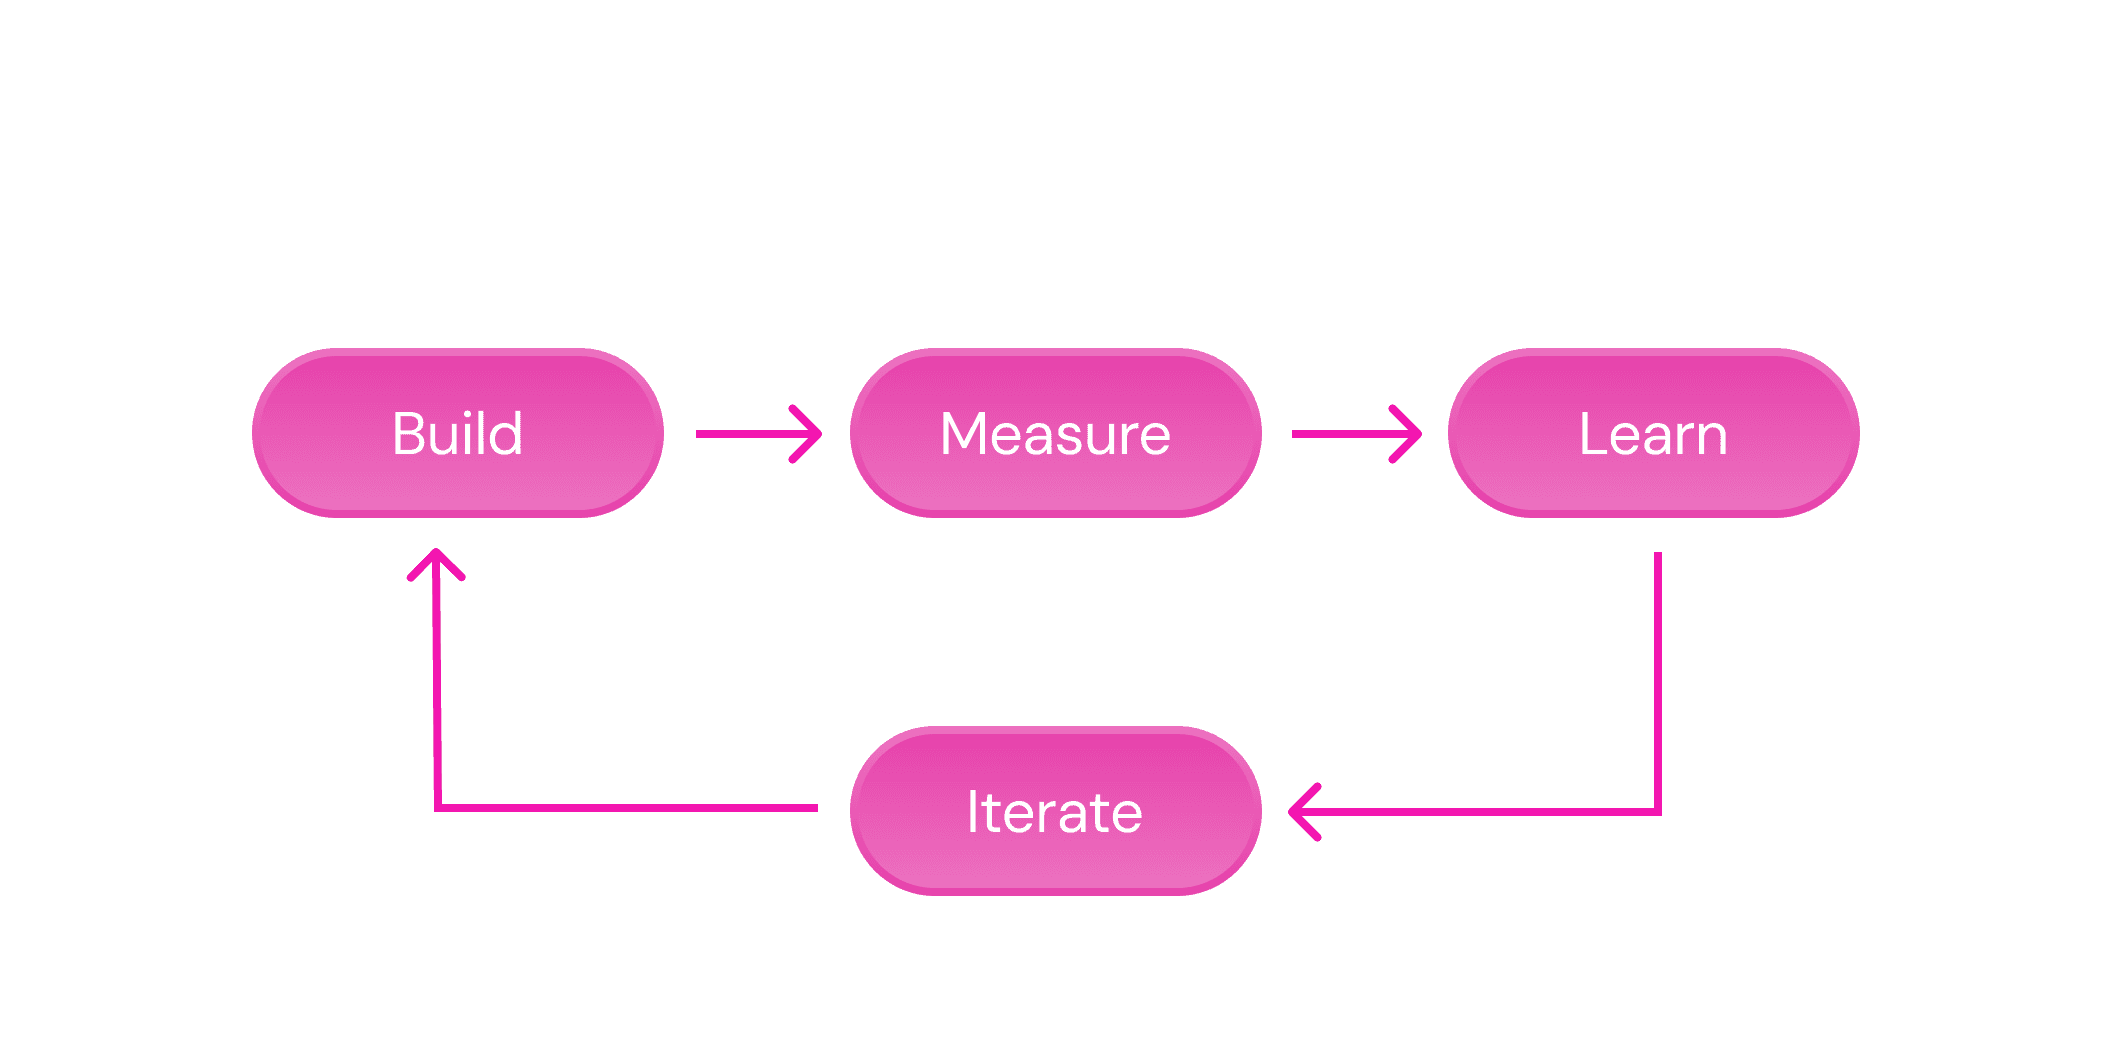
This loop is where the real value lies. You might experiment with boosting certain content types, compare a “For You” feed against a “Trending” one, or test how aggressive your spam filter should be. Stats give you the feedback to decide which version to keep and which to discard.
Example scenarios
Case study 1: two feeds looked similar on impressions and DAU, but the personalized variant delivered 2.5× higher post engagement % and a higher user engagement %, confirming better relevance without shrinking reach.
Case study 2: for a customer team working on moderation, after tightening spam rules, unique authors stayed flat while post engagement % rose, indicating healthier content without suppressing creator diversity.
Best practices
The most important thing is patience. Single-day spikes don’t mean much, so track at least thirty days of data before making adjustments. Also, don’t fall into the trap of watching just one metric — a feed can look strong on impressions but weak on engagement, or diverse in posts but narrow in authors. Balance is key.
Most of all, treat stats as part of an ongoing cycle rather than a one-time report. The more you iterate, the better your feeds will get.
Start measuring today
Feed stats are live in the ❜embed Console. Open your feed, review DAU, impressions, post engagement %, user engagement %, unique authors, and unique posts, then plan your next iteration based on what the numbers tell you.